Max Temperature
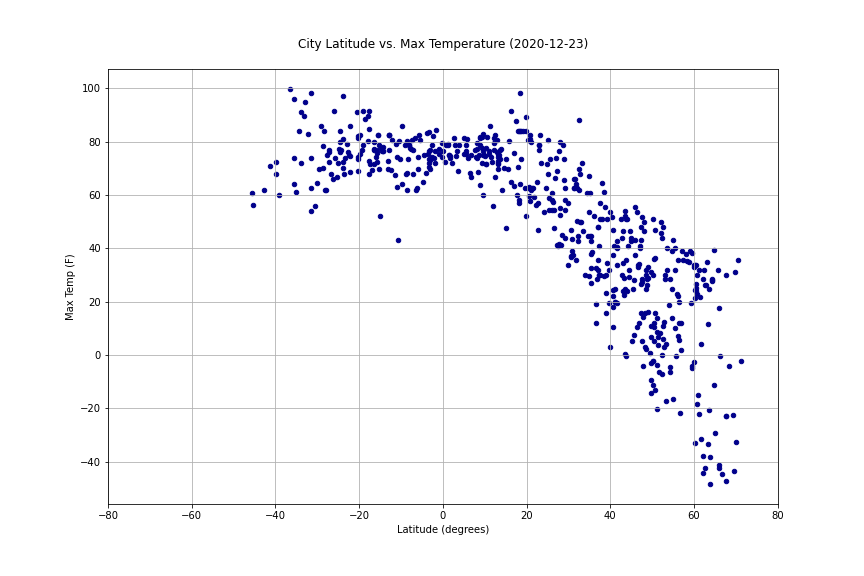
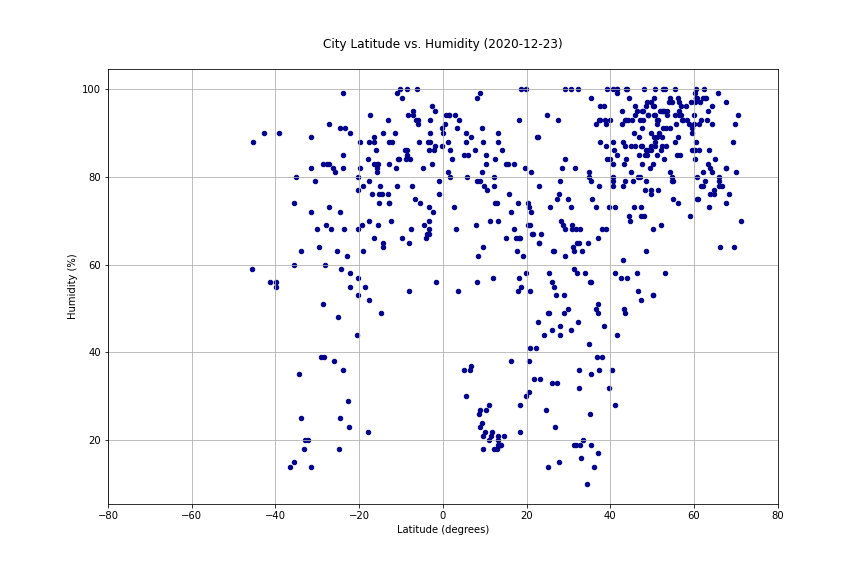
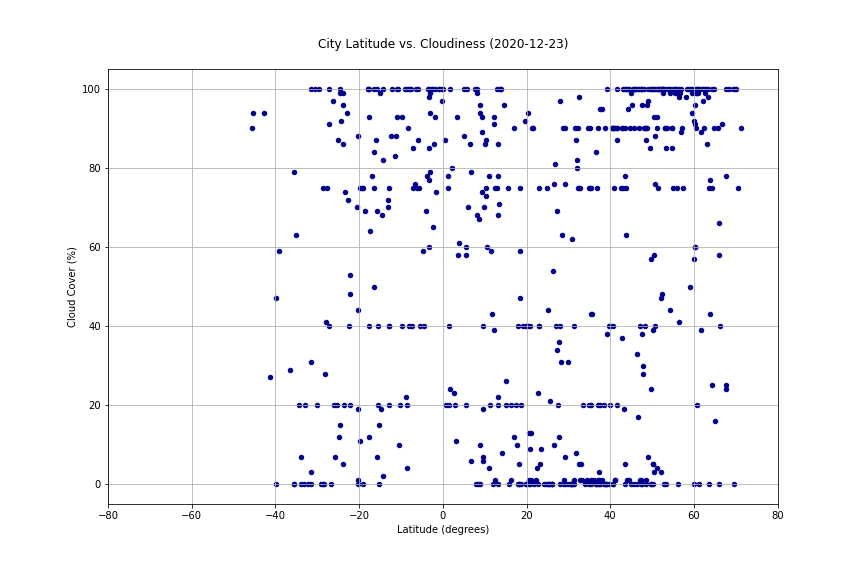
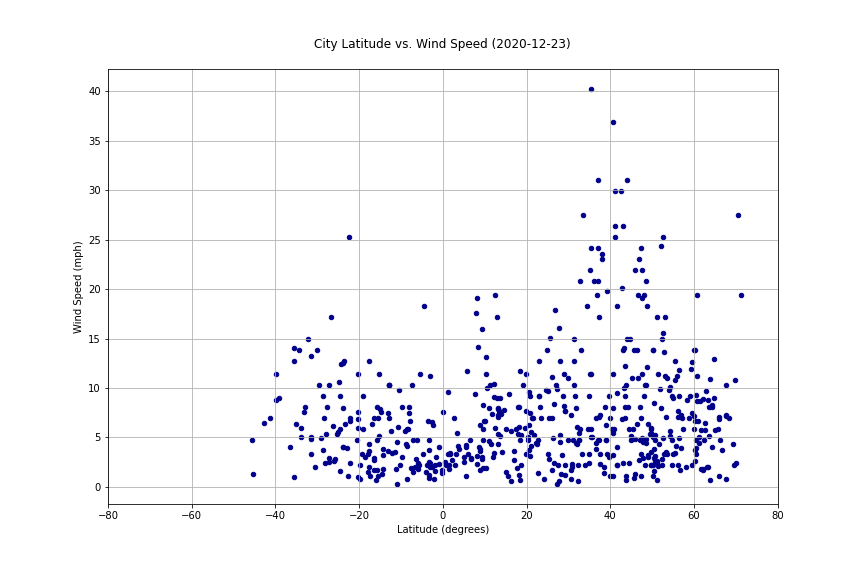
This exercise provided visual and quantitative evidence that the earth tends to get hotter toward the equator. The scatter plots for City Latitude vs. Temperature (2020-12-23), and for same variables by just Northern Hemisphere and then by just Southern Hemisphere, provide reasonable evidence that temperature and certain other weather conditions change with distance from the equator.
We note that the best time of the year to measure the temperature differential by latitude would be on the Spring or Fall Equinox, when the Sun is exactly above the Equator and day and night are of equal length in Northern and Southern Hemispheres. However, we didn't have the luxury of being able to gather temperatures on those dates or to take multiple weather readings around the world over a year long period, which would have given us another method of capturing information that could cancel out effects of the earth's axis running at a 22 degree angle to the solar ecliptic.
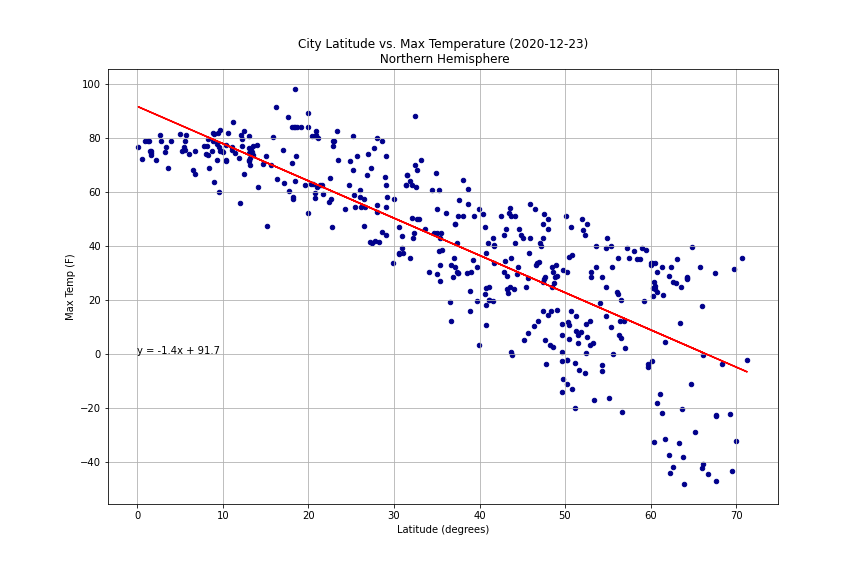
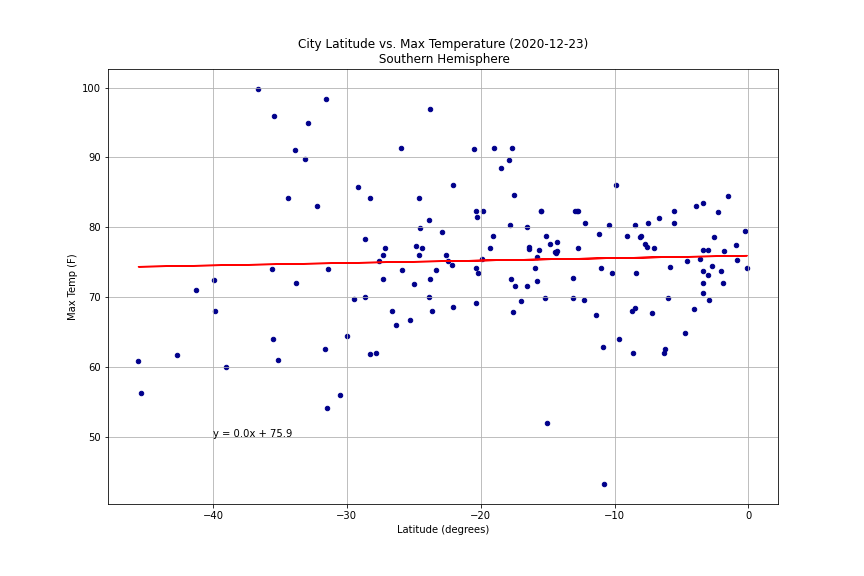
That said, with the understanding that it is now three months since the Fall Equinox, what we find is that in the Northern Hemisphere, currently right on the threshold of the Winter season, the scatter plot shows a relatively tight concentration of temperature-latitude data points that describe temperatures falling as latitudes increase from the equator toward the poles (north pole in this case). Meanwhile, the Southern Hemisphere temperature-latitude data points also describe a falling off as latitudes increase from the equator toward the poles (south pole in this case).
But the Southern Hemisphere's rate of falling off is both not as great and seems less tightly concentrated as that for the Northern Hemisphere. The Northern Hemisphere temperature-latitude slope we calculated is -1.4 while the Southern Hemisphere temperature-latitude slope we calculated is 0.0. (We measured these at -1.1 and 0.3 approximately a month ago.)
The difference likely reflects the longer duration of daylight in the Southern Hemisphere, but to prove this hypothesis, we would probably want to study more temperature readings at more dates through the year. And maybe through some number of years.
We also observe that the latitude of cities in our sample in the Southern Hemisphere is relatively more tightly concentrated; they range generally between 0 degrees (equator) and 40 degrees South. By contrast, latitude of cities in our sample in the Northern Hemisphere is relatively more spread out; they range generally between 0 degrees (equator) and 70 degrees North.
We also note that the Northern Hemisphere has 68% of the Earth's land by area, while the Southern Hemisphere has 32%, and that the land makes up only 29% of the planet's crustal surface. We believe this reflects the study methodology of selecting a random sample of cities, and then taking temperatures for them. We believe a further important major factor for consideration is that large bodies of water generally tend to take longer to heat or to cool than does the land. The temperatures of such large bodies of water affect ambient weather conditions not only over the water but also certainly over coastal regions and very likely well beyond. The ratio of land surface area to water surface area in the Northern Hemisphere is 7:10 while that ratio is 3:10 in the Southern Hemisphere.