Summary: Latitude vs. X
The purpose of this project was to analyze how weather changes as you get closer to the equator. To accomplish this analysis, we first pulled data from the OpenWeatherMap API to assemble a dataset on over 500 cities.
Since 71% of the surface area of the globe is water, there is a likelihood that 71% of the choices made by randomly selecting geocoordinates will be somewhere other than on land, which means that at least 71% of the cities selected by using random coordinates will be clustered on shorelines. Bottom line, the real task is to randomly select geocoordinates only for the 29% of the planet surface that is land.
Our solution rejected any cities that were greater than 60 miles from the randomly chosen geocoordinates. This required us to measure the distance from the randomly chosen geocoordinates to the nearest city selected. We accomplished this by converting the randomly selected lat-lng coordinates and the city lat-lng coordinates to radians, which allowed us to measure distance. We also rejected cities that did not report any weather measurements. Using this methodology, we were required to start with a list of 4,500 randomly selected lat-lng coordinates in order to consistently yield a list of 500+ cities that report their local weather conditions.
We also observe that it would have made sense to include r-squared calculations and other stochastic analyses to go with the hemisphere regression lines. Only during the phase when we were assembling our observations did we recognize that this would have helped us make the case for the goodness of fit of the regression lines. In other words, r-squares and similar metrics would have strengthened or at least qualified our observations.
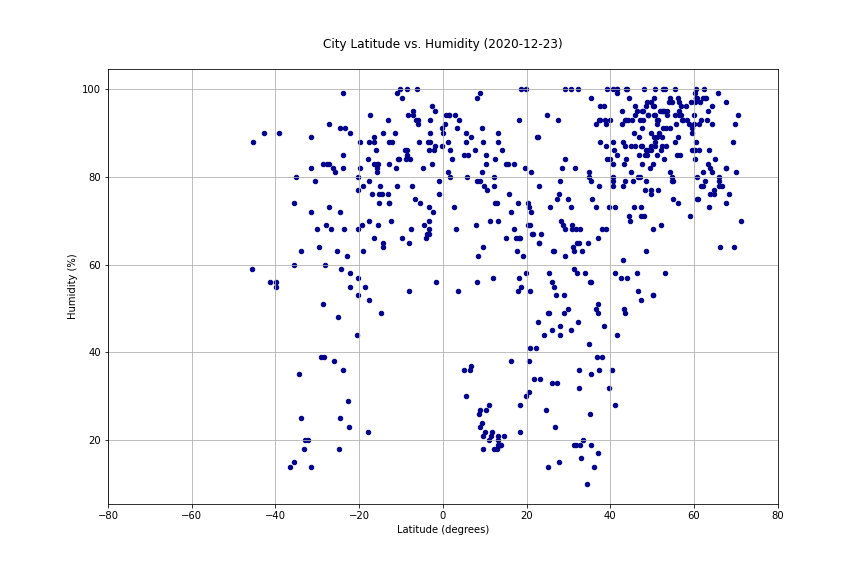
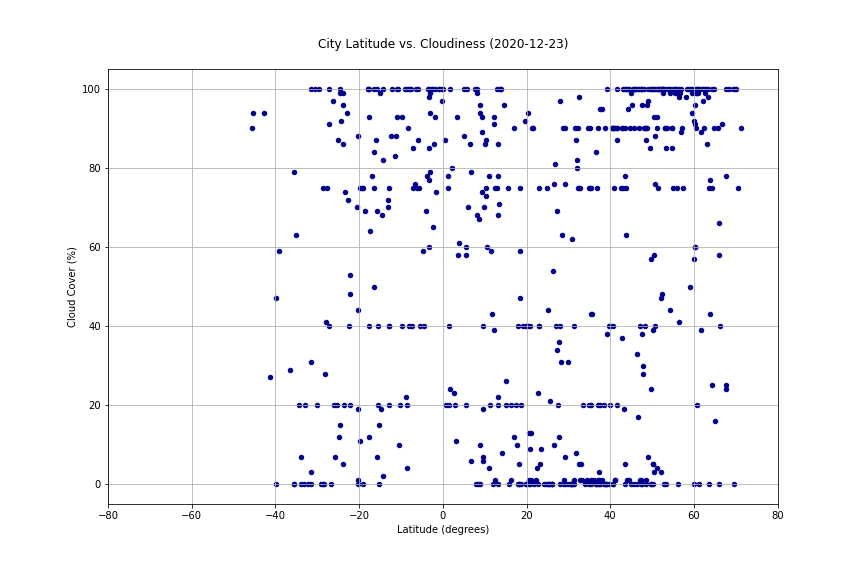
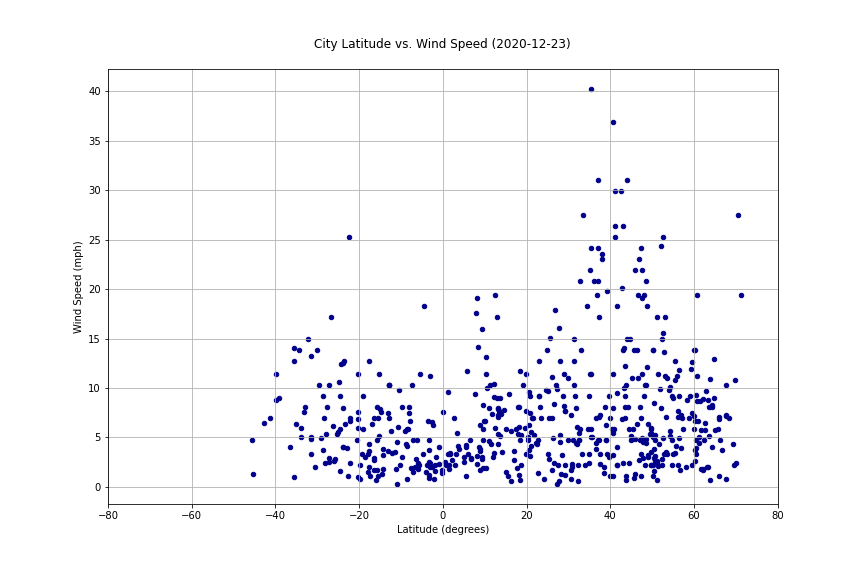
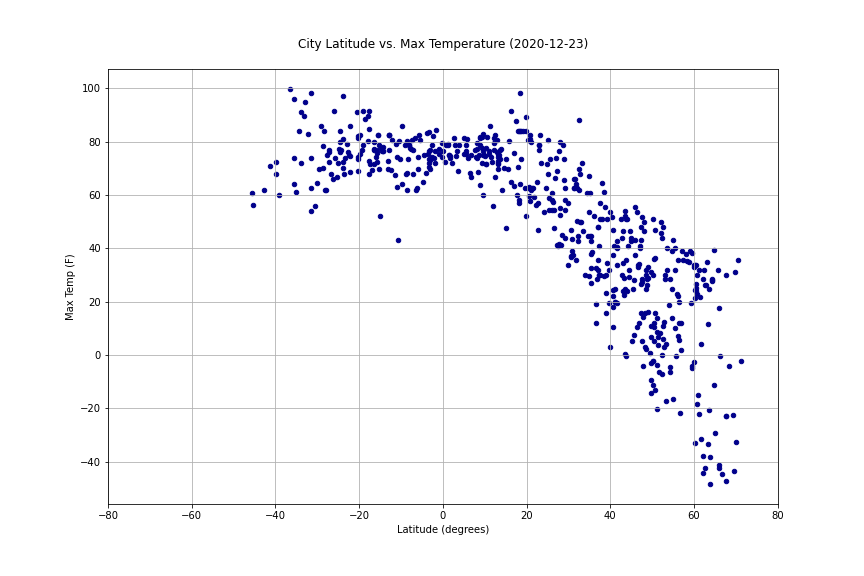
After assembling the dataset, we used Matplolib to plot various aspects of the weather relative to latitude. Factors we analyzed included: temperature, humidity, cloudiness, and wind speed. This site provides the source data and visualizations created as part of the analysis, as well as explanations and descriptions of any trends and correlations witnessed.