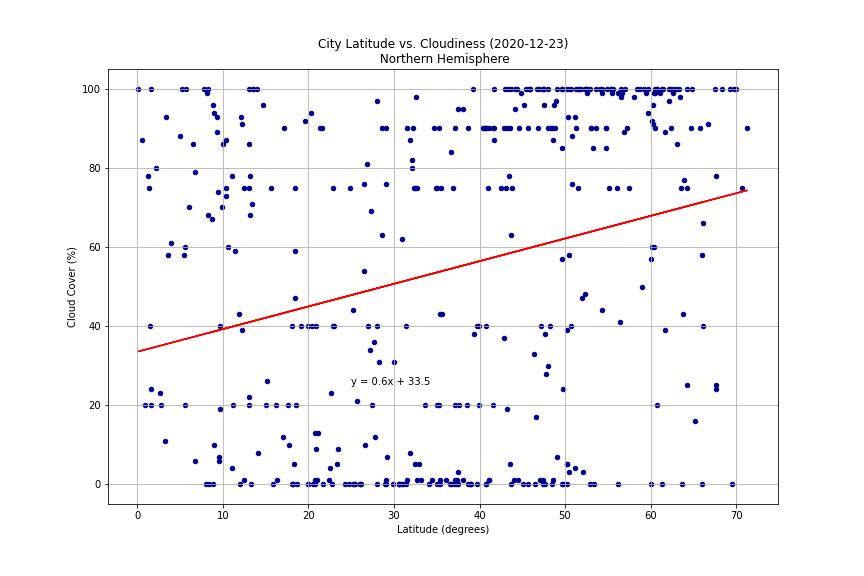
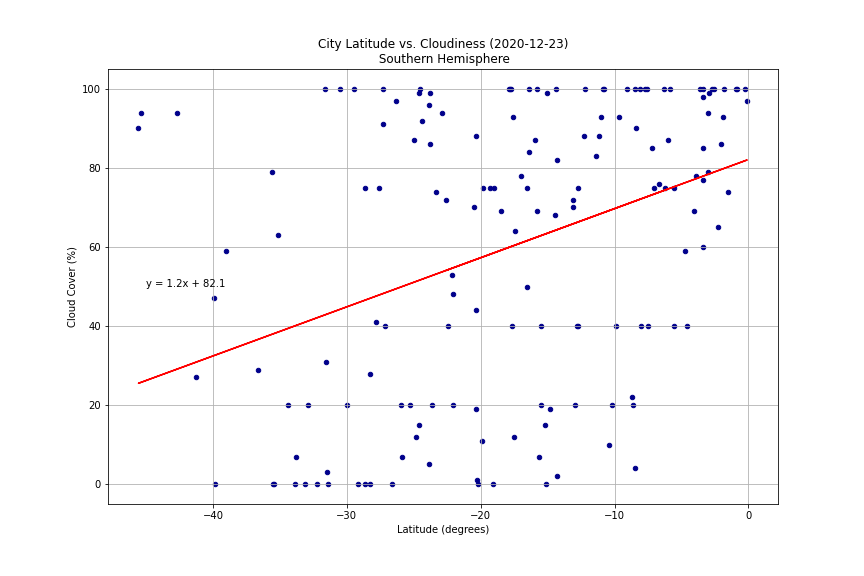
Cloudiness

The scatter plots City Latitude vs. Cloudiness (2020-12-23) by total earth and then for each hemisphere separately seemed less conclusive. (Again, this was comparable to our analysis of measurements made approximately a month ago.) There were also patterns in the data that seem to be methodology driven. Concentrations at 100%, 75%, 40%, 20%, and 0% suggest that cloud cover readings may be human eyeballed rather than measured by radar or some other optical measurement, in that these seem to reflect quantified translations of the way that cloud cover is typically reported: cloudy, clear, partyly cloudy, etc.


